The goal of turfmapper is to plot species * time turf maps.
Installation
You can install turfmapper from GitHub with:
# install.packages("remotes")
remotes::install_github("Between-the-Fjords/turfmapper")
Example
turfmapper is designed for cases when there are cover is recorded at the turf level, and presence-absence at the subturf level. It can also plot data when there are no subturf level data.
library(turfmapper)
library("tidyverse")

data(heath)
heath_long <- heath |>
  pivot_longer(
    cols = matches("^freq\\d+$"),
    names_to = "subturf",
    values_to = "presence",
    names_prefix = "freq",
    names_transform = list(subturf = as.integer)
  ) |>
  filter(presence != "0") # only want presences

# set up subturf grid
grid <- make_grid(ncol = 4)
This function will plot the data from one turf over time.
heath_long |>
  filter(plot == "10.1.") |>
  make_turf_plot(
    data = _,
    year = year, species = species, cover = cover, subturf = subturf,
    site_id = site,
    turf_id = plot,
    grid_long = grid
  )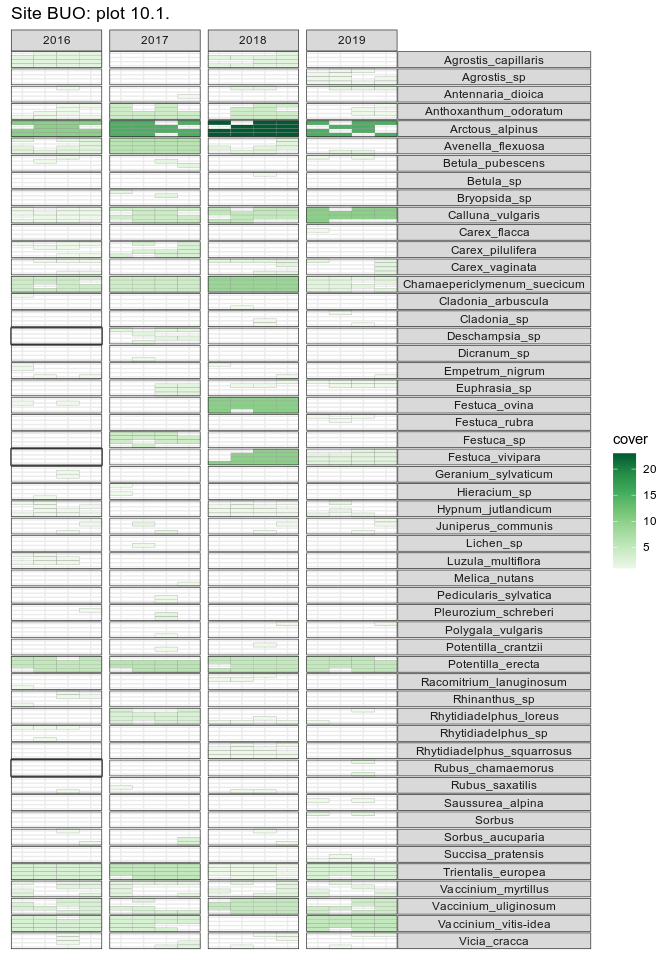
There are a few taxa than need checking here.
See the vignette for plotting multiple turfs.